Flashtrader´s Statistical BandwidthsThe vast majority of traders exclusively concern
themselves with trend-following in all its facets. Scoring
points with trends on a regular basis is a difficult task
since prices do not constantly move in one direction
or another. In the case of the DAX future, for example,
only about 30 per cent of all trading days in a year are
trend days. And of these, there are x percent long ones
and x per cent short ones. Catching the very days when
prices rise or fall from the opening to the close is a major
challenge for a trader who also needs to have previously
recognised the corresponding direction.
However, there are also other ways of profit-taking
every day – for example, by using the mean reversion
strategy. The idea behind this is the fact that prices reach
a high and a low every day – but very rarely close at the
high or the low. This means that prices always move
away from these extreme points and the closing price is
somewhere in between. A profitable trading strategy can
be developed out of this.
But how can you know where the high and the low
will be tomorrow? Is it possible for you to know this in
advance? No – because no one can predict the future. Or
can they? At least it can be statistically determined how
high or low prices could go tomorrow. There is a high
degree of probability that one of the two possibilities
will materialise. It will then be necessary to act.
Calculation
Classic pivot points for the following day are calculated
from the high, low and closing price. But does it really
make sense to use such a mix? I don’t think so and
use a different calculation for this strategy. In a first step,
only the differences between the start and the high or low
are calculated on a daily basis. To avoid being dependent
on individual days and outliers, it is advisable to calculate,
in a second step, the average of these differences over
the past five days. Finally, this average will then be added
at the opening price of the current trading day for the
upper statistical bandwidth and subtracted for the lower
bandwidth.
upper bandwidth = oSTB (violet dashed line in the chart)
lower bandwidth = uSTB (violet dashedline in the chart)
The second interesting question is, if the previous day's high has been exceeded, how much further can the price rise from a mathematical/statistical point of view?
These calculated previous day highs expansions are shown as red dashed lines
Previous day's high expansion = VTHA
Previous day's low expansion = VTTA
For further orientation, the previous day's high (VTH) and the previous day's low (VTT) are shown in light blue dashed lines
And as a supplement, the previous day's close in the DAX Future at 10:00 p.m. VTSA in violet solid lines and the previous day's close in the cash register at 5:30 p.m. VTSN in yellow solid lines
Reaching the calculated extreme values does not mean that the trend has to change immediately, but there is at least temporary exhaustion potential with which you can earn a few points every day in the area of scalping.
Example for cheap entry long:
Example for cheap entry short:
Deutsch:
Die Masse der Trader beschäftigt sich ausschließlich mit Trendfolge in all ihren Facetten. Mit Trends regelmäßig zu punkten ist ein schwieriges Unterfangen, da die Kurse nicht ständig in die eine oder andere Richtung laufen. Beim DAX-Future zum Beispiel sind von allen Börsentagen im Jahr lediglich zirka 30 Prozent Trendtage. Davon sind dann auch noch x Prozent Long und x Prozent Short. Hier genau die Tage abzupassen, an denen die Kurse von Börsenbeginn bis zum Schluss steigen beziehungsweise fallen, ist eine große Herausforderung – wobei der Trader zuvor noch die entsprechende Richtung erkannt haben muss. Es gibt jedoch auch noch andere Methoden täglich Gewinne mitzunehmen, zum Beispiel mit der Mean-Reversion-Strategie (Mittelwertumkehr).
Hintergrund ist die Tatsache, dass die Kurse jeden Tag ein Hoch und ein Tief erreichen – aber sehr selten am Hoch oder am Tief schließen. Das bedeutet, dass die Preise sich immer wie der von diesen Extrempunkten wegbewegen und der Schlusskurs irgendwo dazwischen liegt. Hieraus lässt sich eine profitable Handelsstrategie entwickeln. Aber woher kannst Du wissen, wo morgen das Hoch und das Tief sein wird? Kannst Du das vorher schon wissen? Nein – denn niemand kann die Zukunft vorhersagen. Oder doch? Statistisch lässt sich zumindest bestimmen, wie hoch und wie tief die Kurse morgen steigen oder fallen könnten. Eine Seite wird mit sehr hoher Wahrscheinlichkeit ein treffen. Dann gilt es zu handeln.
Berechnung Klassischer Pivot-Punkte für den folgenden Tag werden aus Hoch, Tief und Schlusskurs berechnet. Aber ist es wirklich sinnvoll, einen solchen Mix zu verwenden? Ich finde das nicht und verwenden für diese Strategie eine andere Berechnung. Im ersten Schritt werden täglich die Differenzen nur vom Start bis zum Hoch beziehungsweise Tief errechnet. Um nicht von einzelnen Tagen und Ausreißern abhängig zu sein, empfiehlt es sich, in einem zweiten Schritt den Durchschnitt dieser Differenzen über die letzten fünf Tage zu errechnen. Zuletzt wird dann dieser Durchschnitt zum Eröffnungskurs des aktuellen Handelstages für die obere statistische Bandbreite addiert und für die untere Bandbreite subtrahiert.
Obere statistische Bandbreite = oSTB (violette gestrichelte Linie im Chart)
Untere statistische Bandbreite = uSTB (violette gestrichelte Linie im Chart)
Die zweite interessante Frage ist, wenn das Vortageshoch überschritten wurde, wie weit kann der Kurs dann noch steigen aus mathematisch/statistischer Sicht?
Diese berechneten Vortagesextremausdehnungen sind als rote gestrichelte Linien dargestellt
Vortageshochausdehnung = VTHA
Vortagestiefausdehnung = VTTA
Für die weitere Orientierung sind die Vortageshochs (VTH) und die Vortagestiefs (VTT) als hellblaue gestrichelte Linien abgebildet.
Als Ergänzung wird noch der Vortages Schluss im Dax Future um 22:00 Uhr VTSA mit einer violetten durchgezogenen Linie und der Kassamarktschluss um 17:30 Uhr mit einer gelben durchgezogenen Linie gezeigt.
Das Erreichen der berechneten Extremwerte bedeutet nicht, das der Trend sofort drehen muss, aber es sind zumindest temporäre Erschöpfungspotentiale mit denen sich im Bereich scalping täglich einige Punkte verdienen lassen.
Beispiel für günstigen Einstieg Long:
Beispiel für günstigen Einstieg Short:
"pivot points" için komut dosyalarını ara

Mars Signals - SSL Trend AnalyzerIntroduction
The "Mars Signals - Precision Trend Analyzer with SSL Baseline & Price Action Zones" is a comprehensive technical analysis tool designed for traders seeking to enhance their market analysis and trading strategies. This indicator integrates multiple advanced trading concepts, including dynamic moving averages, trend detection algorithms, momentum indicators, volume analysis, higher timeframe confirmation, candlestick pattern recognition, and precise price action zones. By combining these elements, the indicator aims to provide clear and actionable buy and sell signals, helping traders to make informed decisions in various market conditions.
Core Components and Functionality
1.Dynamic Baseline Calculation
Moving Average Types: The indicator allows users to select from a variety of moving average types for the baseline calculation, including Simple Moving Average (SMA), Exponential Moving Average (EMA), Hull Moving Average (HMA), Weighted Moving Average (WMA), Double EMA (DEMA), Triple EMA (TEMA), Least Squares Moving Average (LSMA), Triangular Moving Average (TMA), Kijun (from Ichimoku Kinko Hyo), and McGinley's Dynamic.
Baseline Length: Users can customize the length of the moving average, providing flexibility to adjust the sensitivity of the baseline to market movements.
Signal Line Generation: The indicator computes a dynamic signal line based on the relationship between the close price and the moving averages of the high and low prices. This signal line adapts to market volatility and trend changes.
2.SSL Baseline Integration
SSL Baseline: In addition to the primary baseline, the indicator incorporates an SSL (Semaphore Signal Level) Baseline, which further refines trend detection by considering the highs and lows over a specified period.
Dual Confirmation: The combination of the primary baseline and the SSL baseline enhances the reliability of the trend signals by requiring agreement between both baselines before generating a signal.
3.Momentum and Trend Filters
Relative Strength Index (RSI): The indicator uses the RSI to assess the momentum of price movements, filtering out signals that occur during overbought or oversold conditions.
Moving Average Convergence Divergence (MACD): The MACD is employed to identify the direction and strength of the trend, adding another layer of confirmation to the signals.
Average Directional Index (ADX): The ADX measures the strength of the trend, ensuring that signals are generated only when the market shows significant directional movement.
4.Volume Analysis
Volume Filter: An optional volume filter compares the current volume to its moving average, allowing traders to focus on signals that occur during periods of higher market activity.
5.Higher Timeframe Confirmation
Multi-Timeframe Analysis: The indicator can incorporate data from a higher timeframe, comparing the current price to the higher timeframe's baseline and signal line. This feature helps traders align their trades with the broader market trend.
6.Candlestick Pattern Recognition
Bullish Patterns: The indicator detects bullish patterns such as Bullish Engulfing, Piercing Line, Hammer, and Doji.
Bearish Patterns: It also identifies bearish patterns like Bearish Engulfing, Dark Cloud Cover, Shooting Star, and Doji.
Pattern Prioritization: The patterns are prioritized to highlight the most significant formations, which can serve as additional confirmation for trade entries and exits.
7.Price Action Zones
Support and Resistance Levels: The indicator automatically identifies pivot highs and lows to establish dynamic support and resistance levels.
Zone Visualization: It draws shaded rectangles on the chart to represent these zones, providing a clear visual aid for potential reversal or breakout areas.
ATR-Based Zone Width: The zones' thickness is dynamically calculated using the Average True Range (ATR), adjusting to the current market volatility.
Background Coloring: The chart background changes color when the price is above the maximum resistance or below the minimum support, alerting traders to significant price movements.
Interpreting the Signals
1.Buy Signals
Conditions:
Price crosses above the signal line.
RSI is below 70 (not overbought).
MACD line is above the signal line (indicating bullish momentum).
ADX is above the user-defined threshold (default is 20), confirming a strong trend.
(Optional) Volume is above its moving average if the volume filter is enabled.
(Optional) Price is above the higher timeframe baseline and signal line if the higher timeframe filter is enabled.
(Optional) A bullish candlestick pattern is detected if the candlestick pattern filter is enabled.
Visual Indicators:
An upward-pointing label with the text "BUY" appears below the price bar.
The baseline and SSL baseline lines turn to colors indicating bullish conditions.
2.Sell Signals
Conditions:
Price crosses below the signal line.
RSI is above 30 (not oversold).
MACD line is below the signal line (indicating bearish momentum).
ADX is above the user-defined threshold, confirming a strong trend.
(Optional) Volume is above its moving average if the volume filter is enabled.
(Optional) Price is below the higher timeframe baseline and signal line if the higher timeframe filter is enabled.
(Optional) A bearish candlestick pattern is detected if the candlestick pattern filter is enabled.
Visual Indicators:
A downward-pointing label with the text "SELL" appears above the price bar.
The baseline and SSL baseline lines turn to colors indicating bearish conditions.
3.Support and Resistance Zones
Interpretation:
Resistance Zones: Represent areas where the price may face selling pressure. A break above these zones can signal a strong bullish move.
Support Zones: Represent areas where the price may find buying interest. A break below these zones can signal a strong bearish move.
Background Color:
The background turns red when the price is above the maximum resistance, indicating potential overextension.
The background turns green when the price is below the minimum support, indicating potential undervaluation.
Effective Usage Strategies
1.Customization
Adjusting Baseline and SSL Settings: Traders should experiment with different moving average types and lengths to match their trading style and the specific characteristics of the asset being analyzed.
Filtering Parameters: Modify RSI, MACD, and ADX settings to fine-tune the sensitivity of the signals.
Volume and Higher Timeframe Filters: Enable these filters to add robustness to the signals, especially in volatile markets or when trading higher timeframes.
2.Combining with Other Analysis
Fundamental Analysis: Use the indicator in conjunction with fundamental insights to validate technical signals.
Risk Management: Always apply proper risk management techniques, such as setting stop-loss and take-profit levels based on the support and resistance zones provided by the indicator.
3.Backtesting
Historical Analysis: Utilize the indicator's settings to backtest trading strategies on historical data, helping to identify the most effective configurations before applying them in live trading.
4.Monitoring Market Conditions
Volatility Awareness: Pay attention to the ATR and ADX readings to understand market volatility and trend strength, adjusting strategies accordingly.
Event Considerations: Be cautious around major economic announcements or events that may impact market behavior beyond technical indications.
Indicator Inputs and Customization Options
Baseline Type and Length: Select from multiple moving average types and specify the period length.
ADX Settings: Adjust the length, smoothing, and threshold for trend strength confirmation.
Volume Filter: Enable or disable the volume confirmation filter.
Higher Timeframe Filter: Choose to incorporate higher timeframe analysis and specify the desired timeframe.
Candlestick Patterns: Enable or disable the detection of candlestick patterns for additional signal confirmation.
SSL Baseline Type and Length: Customize the SSL baseline settings separately from the primary baseline.
Price Action Zones Settings:
Zone Thickness: Adjust the visual thickness of the support and resistance zones.
Lookback Period: Define how far back the indicator looks for pivot points.
ATR Multiplier for Zone Width: Set the multiplier for ATR to determine the dynamic width of the zones.
Maximum Number of Zones: Limit the number of support and resistance zones displayed.
Pivot Bars: Customize the number of bars to the left and right used for identifying pivot highs and lows.
Conclusion
The "Mars Signals - Precision Trend Analyzer with SSL Baseline & Price Action Zones" is a versatile and powerful tool that amalgamates essential technical analysis techniques into a single, user-friendly indicator. By providing clear visual signals and incorporating multiple layers of confirmation, it assists traders in identifying high-probability trading opportunities. Whether you are a day trader, swing trader, or long-term investor, this indicator can be tailored to suit your trading style and enhance your decision-making process.
To maximize the benefits of this indicator:
Understand Each Component: Familiarize yourself with how each part of the indicator contributes to the overall signal generation.
Customize Thoughtfully: Adjust the settings based on the asset class, market conditions, and your risk tolerance.
Practice Diligently: Use demo accounts or paper trading to practice and refine your strategy before deploying it in live markets.
Stay Informed: Continuously educate yourself on technical analysis and market dynamics to make the most informed decisions.
Disclaimer
Trading financial markets involves risk, and past performance is not indicative of future results. This indicator is a tool to aid in analysis and should not be the sole basis for any trading decision. Always conduct your own research and consider consulting with a licensed financial advisor.

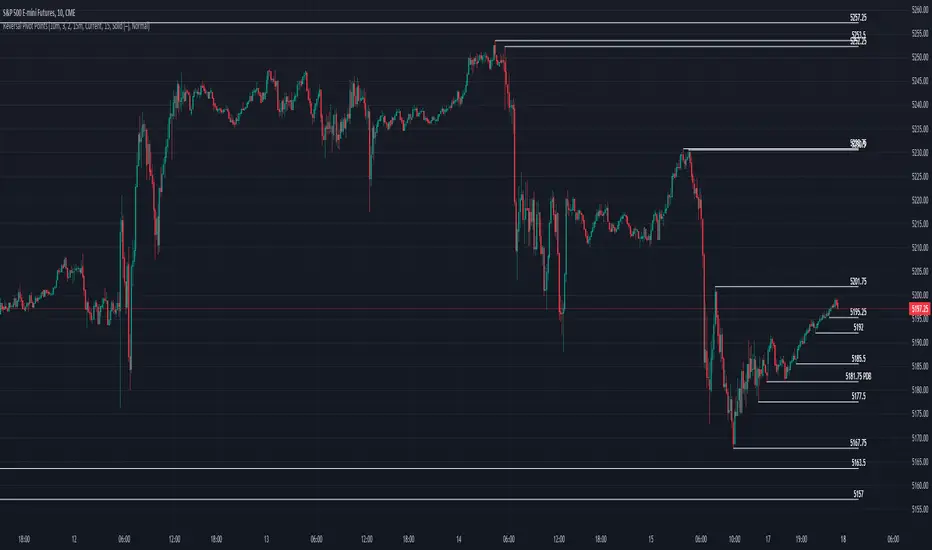
Reversal Pivot PointsThis indicator aims to identify price levels where price action has quickly reversed from. These "pivots" establish major levels where major liquidity is located. Unlike standard support and resistance levels, when price breaks below or above a pivot, these pivots disappear from the chart. Comes with various customization features built to fit all.
Features
Pivot Timeframe: Identify and plot pivots from one specific timeframe and see it from all lower timeframes
Pivot left/right bar limit: A feature aimed at preventing false pivots identification
Remove On Close (ROC): Feature to only remove pivots once price close under it
ROC Timeframe: The timeframe the script uses to determine if the candle closed under the level
Wait For Close: Will only remove the pivot after the current candle closes
Line Extension Type: The extension of the line. None - extends line to current time, left - only extends line to the left, right - only extends line to the right, both - extends line both directions
Line Offset: How much to offset (in bars) the line and label from the current candle
Line Type: The style of line when plotted. Solid (─), dotted (┈), dashed (╌), arrow left (←), arrow right (→), arrows both (↔)
Display Level: Whether to or not to display the price of the pivot
Display Perfect Level: Whether to or not to display levels where price perfectly rejected off of
Alerts: Creates an alert when a level has been crossed
How to trade
1. Pivots can be traded to or from. The stock market (market makers) will tend to "chase" liquidity in order to fill orders at better averages. This allows us retail traders to to participate alongside these moves to these pivots. Once price action hits a pivot, it can do two things: break the pivot and continue or bounce off it. We can participate alongside these bounces after confirmation of a reversal (doji, volume, etc). These bounce plays are high risk as it's generally 50-50, but the risk to reward is typically also very high, making them very valuable to take.
2. Typically, the market is a fluid environment and should be "natural," so perfect things (manmade and filled with liquidity) should not occur. With this knowledge, we can expect these perfect levels, "PDT/PDB," to break as they are not natural occurrence and have heavy liquidity on and above/below them. We can trade to these levels and expect them to break/sweep if price action comes near them again.
chartpatternsLibrary "chartpatterns"
Library having complete chart pattern implementation
method draw(this)
draws pattern on the chart
Namespace types: Pattern
Parameters:
this (Pattern) : Pattern object that needs to be drawn
Returns: Current Pattern object
method erase(this)
erase the given pattern on the chart
Namespace types: Pattern
Parameters:
this (Pattern) : Pattern object that needs to be erased
Returns: Current Pattern object
method findPattern(this, properties, patterns)
Find patterns based on the currect zigzag object and store them in the patterns array
Namespace types: zg.Zigzag
Parameters:
this (Zigzag type from Trendoscope/ZigzagLite/2) : Zigzag object containing pivots
properties (PatternProperties) : PatternProperties object
patterns (Pattern ) : Array of Pattern objects
Returns: Current Pattern object
PatternProperties
Object containing properties for pattern scanning
Fields:
offset (series int) : Zigzag pivot offset. Set it to 1 for non repainting scan.
numberOfPivots (series int) : Number of pivots to be used in pattern search. Can be either 5 or 6
errorRatio (series float) : Error Threshold to be considered for comparing the slope of lines
flatRatio (series float) : Retracement ratio threshold used to determine if the lines are flat
checkBarRatio (series bool) : Also check bar ratio are within the limits while scanning the patterns
barRatioLimit (series float) : Bar ratio limit used for checking the bars. Used only when checkBarRatio is set to true
avoidOverlap (series bool)
patternLineWidth (series int) : Line width of the pattern trend lines
showZigzag (series bool) : show zigzag associated with pattern
zigzagLineWidth (series int) : line width of the zigzag lines. Used only when showZigzag is set to true
zigzagLineColor (series color) : color of the zigzag lines. Used only when showZigzag is set to true
showPatternLabel (series bool) : display pattern label containing the name
patternLabelSize (series string) : size of the pattern label. Used only when showPatternLabel is set to true
showPivotLabels (series bool) : Display pivot labels of the patterns marking 1-6
pivotLabelSize (series string) : size of the pivot label. Used only when showPivotLabels is set to true
pivotLabelColor (series color) : color of the pivot label outline. chart.bg_color or chart.fg_color are the appropriate values.
allowedPatterns (bool ) : array of bool encoding the allowed pattern types.
themeColors (color ) : color array of themes to be used.
Pattern
Object containing Individual Pattern data
Fields:
pivots (Pivot type from Trendoscope/ZigzagLite/2) : array of Zigzag Pivot points
trendLine1 (Line type from Trendoscope/LineWrapper/1) : First trend line joining pivots 1, 3, 5
trendLine2 (Line type from Trendoscope/LineWrapper/1) : Second trend line joining pivots 2, 4 (, 6)
properties (PatternProperties) : PatternProperties Object carrying common properties
patternColor (series color) : Individual pattern color. Lines and labels will be using this color.
ratioDiff (series float) : Difference between trendLine1 and trendLine2 ratios
zigzagLine (series polyline) : Internal zigzag line drawing Object
pivotLabels (label ) : array containning Pivot labels
patternLabel (series label) : pattern label Object
patternType (series int) : integer representing the pattern type
patternName (series string) : Type of pattern in string

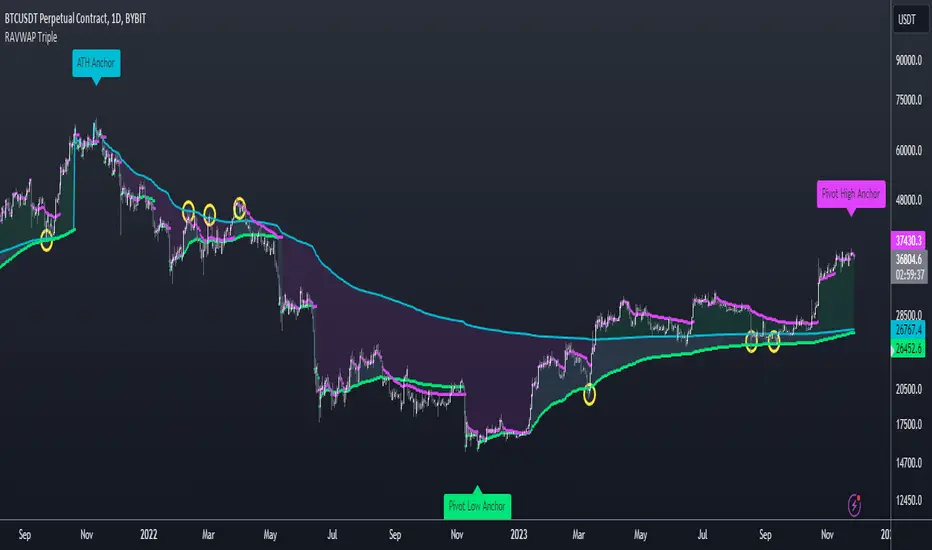
Re-Anchoring VWAP TripleThe Triple Re-Anchoring VWAP (Volume Weighted Average Price) indicator is a tool designed for traders seeking a deeper understanding of market trends and key price levels. This indicator dynamically recalibrates VWAP calculations based on significant market pivot points, offering a unique perspective on potential support and resistance levels.
Key Features:
Dynamic Re-anchoring at All-Time Highs (ATH) : The first layer of this indicator continuously tracks the all-time high and recalibrates the VWAP from each new ATH. This VWAP line, typically acting as a dynamic resistance level, offers insights into the overbought conditions and potential reversal zones.
Adaptive Re-anchoring to Post-ATH Lows : The second component of the indicator shifts focus to the market's reaction post-ATH. It identifies the lowest low following an ATH and re-anchors the VWAP calculation from this point. This VWAP line often serves as a dynamic support level, highlighting key areas where the market finds value after a significant high.
Re-anchoring to Highs After Post-ATH Lows : The third element of this tool takes adaptation one step further by tracking the highest high achieved after the lowest low post-ATH. This VWAP line can act as either support or resistance, providing a nuanced view of the market's valuation in the recovery phase or during consolidation after a significant low.
Applications:
Trend Confirmation and Reversal Signals : By comparing the price action relative to the dynamically anchored VWAP lines, traders can gauge the strength of the trend and anticipate potential reversals.
Entry and Exit Points : By highlighting significant support and resistance areas, it assists in determining optimal entry and exit points, particularly in swing trading and mean reversion strategies.
Enhanced Market Insight : The dynamic nature of the indicator, with its shifting anchor points, offers a refined understanding of market sentiment and valuation changes over time.
Why Triple Re-Anchoring VWAP?
Traditional VWAP tools offer a linear view, often missing out on the intricacies of market fluctuations. The Triple Re-Anchoring VWAP addresses this by providing a multi-faceted view of the market, adapting not just to daily price changes but pivoting around significant market events. Whether you're a day trader, swing trader, or long-term investor, this indicator adds depth to your market analysis, enabling more informed trading decisions.
Examples:
Double Tops & Bottoms [QuantVue]This indicator is designed to detect and plot Double Tops and Double Bottoms, by setting the initial high or low using standard pivot points.
Double Tops
A Double Top is a bearish reversal pattern, typically found when an uptrend returns back to a prior peak. It signifies a potential turning point or resistance level and could potentially reverse in direction.
The pattern is confirmed as a Double Top when the price breaks above the resistance level, but closes below it. A decisive close below this level is seen as a confirmation of the bearish trend.
Double Bottoms
A Double Bottom, on the other hand, is a bullish reversal pattern typically found after a downtrend. It signals a potential turning point or support level where the price has bottomed and could potentially reverse upwards.
The pattern is confirmed as a Double Bottom when the price breaks below the support level, but closes above it. A decisive close above this level is viewed as a confirmation of the bullish trend.
Indicator Features
🔹Double Top Detection: When a double top is identified, a downward-pointing triangle will be plotted above the bar, and if the alerts are enabled, a notification will be triggered.
🔹Double Bottom Detection: When a double bottom is identified, an upward-pointing triangle will be plotted below the bar, and if the alerts are enabled, a notification will be triggered.
🔹Pivot Lookback: Defines the number of bars to the left and right of the pivot that must be lower/higher to qualify as a pivot.
🔹Maximum Length Between Tops/Bottoms: Maximum number of bars between two tops/bottoms to be considered a double top or bottom.
🔹Style Settings: Allows the user to customize the appearance of the lines indicating the tops/bottoms. Options include color selection, line style (dotted, dashed, or solid), and line thickness.
🔹Alerts: The user can enable or disable alerts for Double Top and Double Bottom.
Give this indicator a BOOST and COMMENT your thoughts!
We hope you enjoy.
Cheers!

2nd 3rd 4th Order PivotsThis indicator calculates pivots of 2nd, 3rd and 4th order in the current timeframe.
The idea is borrowed from the book "The Art and Science of Technical Trading" by Adam Grimes:
"A pivot high is a bar that has a higher high than the bar that came before it and the bar that comes after it"
"Second-order pivot highs are first-order pivot highs that are preceded and followed by lower first-order pivot highs.
The type of picot calculation can be found as well in script "Higher Order Pivots" by rumpypumpydumpy. However, this script is different in the following ways:
1. Shows pivots of order 2, 3 and 4
2. The chart timeframe can be different than the pivot timeframe, allowing e.g. to map daily pivots to intraday charts via lines
3. Labels and/or lines can be used to show pivot points
4. Use of extended session data can be enabled/disabled, independently from the current chart settings
5. To disable older pivots, a starting time for the pivot calculation can be set
Please consider following limitations:
1. Maximum of 500 drawing objects per chart. Use Notification option to keep track of when running out of chart objects.
2. Lookback history: The max lookback history is limited by the currently selected timeframe. E.g. on a 5min timeframe, 20000 bars (Premium Plan) result in approx. 5 months of lookback period, meaning you may want to verify with a 30 min or higher chart to get a complete picture of pivots.

Mean Shift Pivot ClusteringCore Concepts
According to Jeff Greenblatt in his book "Breakthrough Strategies for Predicting Any Market", Fibonacci and Lucas sequences are observed repeated in the bar counts from local pivot highs/lows. They occur from high to high, low to high, high to low, or low to high. Essentially, this phenomenon is observed repeatedly from any pivot points on any time frame. Greenblatt combines this observation with Elliott Waves to predict the price and time reversals. However, I am no Elliottician so it was not easy for me to use this in a practical manner. I decided to only use the bar count projections and ignore the price. I projected a subset of Fibonacci and Lucas sequences along with the Fibonacci ratios from each pivot point. As expected, a projection from each pivot point resulted in a large set of plotted data and looks like a huge gong show of lines. Surprisingly, I did notice clusters and have observed those clusters to be fairly accurate.
Fibonacci Sequence: 1, 2, 3, 5, 8, 13, 21, 34...
Lucas Sequence: 2, 1, 3, 4, 7, 11, 18, 29, 47...
Fibonacci Ratios (converted to whole numbers): 23, 38, 50, 61, 78, 127, 161...
Light Bulb Moment
My eyes may suck at grouping the lines together but what about clustering algorithms? I chose to use a gimped version of Mean Shift because it doesn't require me to know in advance how many lines to expect like K-Means. Mean shift is computationally expensive and with Pinescript's 500ms timeout, I had to make due without the KDE. In other words, I skipped the weighting part but I may try to incorporate it in the future. The code is from Harrison Kinsley . He's a fantastic teacher!
Usage
Search Radius: how far apart should the bars be before they are excluded from the cluster? Try to stick with a figure between 1-5. Too large a figure will give meaningless results.
Pivot Offset: looks left and right X number of bars for a pivot. Same setting as the default TradingView pivot high/low script.
Show Lines Back: show historical predicted lines. (These can change)
Use this script in conjunction with Fibonacci price retracement/extension levels and/or other support/resistance levels. If it's no where near a support/resistance and there's a projected time pivot coming up, it's probably a fake out.
Notes
Re-painting is intended. When a new pivot is found, it will project out the Fib/Lucas sequences so the algorithm will run again with additional information.
The script is for informational and educational purposes only.
Do not use this indicator by itself to trade!

HTF Candles & PivotsThis indicator displays HTF candles and pivot points.
The candles are displayed in a box and you can select Open-Close, High-Low or both.
You can show all of the past, or just "today only" or "previous day only".
You can also shift one previous candle to the current one.
The pivot point is the normal one.
There is an option to display CPR (Central pivot range).
Example: Shift previous to current

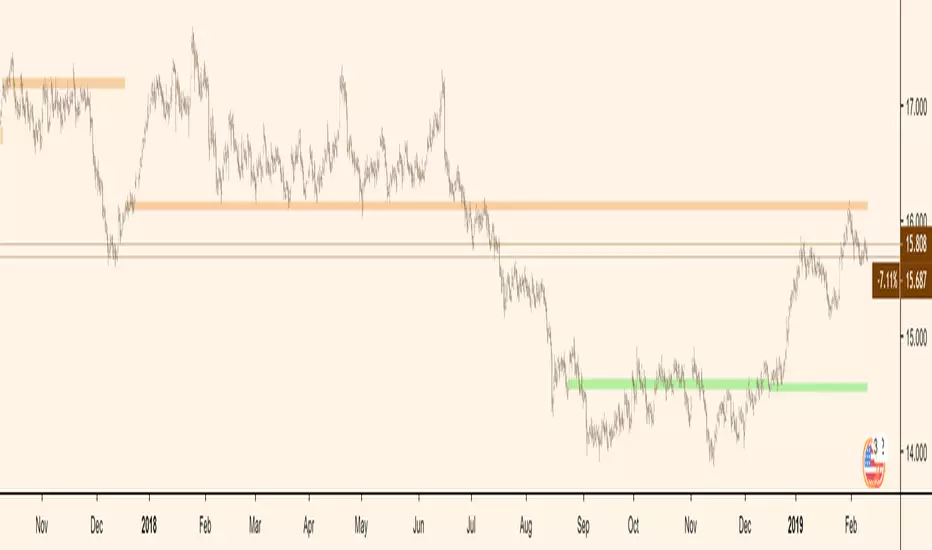
Pocket PivotsPocket Pivots are described in the book "Trade like an O'Neil Discipline" by Dr. Chris Kacher and Gil Morales. There’s no exact definition of Pocket Pivots, but there is an exact definition for the volume signature: The volume should be higher than the largest down volume of the last 10 trading days.
This is a modification of Pocket Pivots. We use the level where the Pocket Pivot occurred and draw a zone across the chart until the criteria for another Pocket Pivot is met again. This way we can use them as support/resistance zones. Instead of the volume being higher than the volume for each of the previous periods, we just use an SMA of the volume and make sure the volume on the final candle is higher than the average for the previous periods. Last but not least, we have the possibility to draw support/resistance levels off the back of different counts. Seven-count for hyper-aggressive pocket pivots, eight-count for aggressive, nine for measured and ten for passive.
Hyper-aggressive Pocket Pivots
Aggressive Pocket Pivots
Measured Pocket Pivots
Passive Pocket Pivots
All
Using "All" to see all the pivots can be messy, but the confluence of support/resistance is more than helpful for defining truly important levels.
People have created a methodology/rules for buying and selling with Pivot Points, but as I understand there's no general consensus on their application, so please do some research before you decide to use them in your trading.
References
www.chartmill.com
www.mypivots.com
Want to Learn?
If you'd like the opportunity to learn Pine but you have difficulty finding resources to guide you, take a look at this rudimentary list: docs.google.com
The list will be updated in the future as more people share the resources that have helped, or continue to help, them. Follow me on Twitter to keep up-to-date with the growing list of resources.
Suggestions or Questions?
Don't even kinda hesitate to forward them to me. My (metaphorical) door is always open.
Yetty Trades ORB Strat With Key Levels NQ RTHMust Have Confirmation of ORB on 5 and 15 Min chart. Follow Retracement.
Key Daily & HTF Levels
Track intraday, daily, weekly, and monthly H/L - RTH daily levels ignore pre-market
Current Day H/L (RTH Only)
Previous Day H/L (RTH Only)
2 Days Previous H/L
Pre-Market H/L (Separate)
Weekly H/L
Monthly H/L
NEW
Open Price Levels
Previous period opening prices - key mean reversion and magnet levels
Previous Day Open (PDO)
Previous Week Open (PWO)
Previous Month Open (PMO)
NY Open Line
London Open Line
Session Levels
Monitor Asian and London session highs, lows, and opens
Asian Session H/L
London Session H/L
NY Open Price
London Open Price
Customizable Times
15-Min Opening Range + Signals
Current day only OR box - resets daily + breakout signals with pullback & volume confirmation
Current Day Only
No Historical Clutter
ORB Midpoint Line
Breakout/Pullback Signals
Volume Confirmation
Adjustable Signal Size
NEW
VWAP + SD Bands
VWAP with Standard Deviation bands for institutional-grade analysis
Intraday VWAP
±1 SD Band (Green)
±2 SD Band (Orange)
±3 SD Band (Red)
Dynamic S/R
NEW
Pivot Points
Classic daily pivot points with support and resistance levels
Daily Pivot (P)
R1 & R2 Resistance
S1 & S2 Support
Based on Prior Day
NEW
Fair Value Gaps (FVG)
Smart Money / ICT concept - highlight price imbalances that tend to fill
Bullish FVGs (Green)
Bearish FVGs (Red)
Adjustable Lookback
Min Gap Size Filter
Moving Averages + Strategy
EMAs with built-in Double EMA Pullback buy/sell signal strategy
9 EMA
21 EMA
200 EMA
EMA Pullback Signals
HTF EMA Filter
NEW
200 EMA Bounce Signals
Detect when price uses 200 EMA as dynamic support or resistance
Support Bounce (Green)
Resistance Bounce (Red)
Touch Distance Filter
Confirmation Bars
NEW
Signal Filters
Filter signals by higher timeframe trend and high-volume trading hours
HTF EMA Trend Filter
Time-Based Filter
Power Hour 1 (9:30-11:30)
Power Hour 2 (2:00-4:00)
NEW
ATR-Based Stop Levels
Automatic stop loss suggestions based on ATR when signals fire
14-Period ATR
1.5x ATR Multiplier
Visual Stop Markers
Risk Management
NEW
Statistics Table
On-chart performance dashboard with customizable metrics
Win Rate Display
Total Signal Count
Buy/Sell Breakdown
Position Options
Reversal Patterns
Automatically detect bullish and bearish hammer candlestick patterns
Bullish Hammers
Bearish Hammers
Visual Labels
Fully Customizable - All New Features OFF by Default
Every level has individual controls. New features are disabled by default to keep your chart clean - enable what you need!
Toggle Any Level On/Off
Line Style Per Level
Line Width Per Level
4 Label Display Types
Custom Colors
Solid / Dashed / Dotted
VWAP Band Multipliers
FVG Size Filters
ATR Multiplier
Stats Display Options
HTF Timeframe Choice
Power Hour Times
Trading Strategy Guide
How to use this indicator for breakout trading with pullback entries
Phase 1
Identify Setup
Look for price consolidating near key levels (previous day H/L, session H/L)
Check if price is respecting EMAs (9, 21, or 200)
Note the opening range box boundaries
Watch for price approaching VWAP
Phase 2
Wait for Breakout
Wait for price to break above/below opening range
Look for breakout beyond session highs/lows
Confirm with volume and momentum
Watch for bullish/bearish hammer patterns at key levels
Phase 3
Enter on Pullback
After breakout, wait for price to pull back to EMAs
Look for price to retest the opening range boundary
Enter when price finds support/resistance at key levels
Use hammer patterns as entry confirmation signals
Grizzology-Style Clean Layout
• Daily Reset: All levels automatically reset each day - no historical clutter
• Current Day Only: Opening Range box only shows for today's session
• Clean Lines: Levels use lines instead of extending plots for cleaner charts
• Labels: CDH, CDL, PDH, PDL, PMH, PML labels for easy identification
• Pre-Market: Track pre-market high/low levels (04:00-09:30)
Trading Tips
• Risk Management: Always use stop losses below/above key levels
• Confirmation: Wait for multiple indicators to align before entering
• Time of Day: Breakouts during London/New York open tend to be more reliable
• Volume: Higher volume on breakouts increases probability of success
• False Breakouts: Opening range helps filter out early false moves
Example Trade Setup
1. Market Opens: Opening range box forms in first 15 minutes (9:30-9:45 AM)
2. Consolidation: Price trades within the OR box, respecting boundaries
3. Breakout: Price breaks above OR high with strong momentum, confirmed by volume
4. Pullback: Price pulls back to test the OR high (now support) and 21 EMA
5. Entry: Bullish hammer forms at the pullback level → Enter long
6. Target: Previous day high or session high
7. Stop Loss: Below the pullback low or below OR box

Digital MACD Divergences MTF [LUPEN]Digital MACD Divergences MTF V1.0
Overview:
Digital MACD Divergences MTF is an advanced momentum oscillator based on digital signal processing techniques.
Instead of relying on traditional moving-average smoothing, it applies Finite Impulse Response (FIR) digital filters to extract momentum more cleanly, reducing lag and short-term market noise.
The indicator is designed to provide a clear visualization of momentum structure, divergence behavior, and multi-timeframe context, rather than discrete trading signals.
Conceptual Architecture
At its core, the indicator reinterprets the classic MACD framework through digital convolution logic:
FIR filters are used to compute momentum in a more responsive and stable manner than standard EMA-based MACD.
The resulting histogram represents momentum intensity and direction as a continuous state rather than binary conditions.
A digitally smoothed signal line provides structural reference without introducing excessive delay.
This approach emphasizes momentum quality and structure, not signal frequency.
Divergence Detection Logic:
The script includes automatic divergence detection based on pivot analysis:
Regular bullish and bearish divergences are identified using confirmed pivot points.
Divergences are visualized with explicit line structures and optional filled areas, highlighting the zone of disagreement between price behavior and momentum.
The visualization is designed to remain readable without obscuring price action.
Divergences are presented as contextual information, not as mandatory actions.
Multi-Timeframe (MTF) Context
Digital MACD Divergences MTF supports native multi-timeframe analysis through a dual-pane workflow:
A lower-timeframe instance visualizes local momentum dynamics.
A higher-timeframe instance visualizes the broader momentum regime within which lower-timeframe fluctuations occur.
The higher-timeframe view is not intended as confirmation or filtering logic, but as a contextual background layer that helps interpret short-term momentum behavior inside a larger structural environment.
This separation avoids decision compression and keeps each timeframe’s role conceptually distinct.
Visual Design
Gradient-based histogram fills represent momentum intensity in a continuous manner.
Positive and negative momentum regions are clearly differentiated while remaining adaptable to both dark and light chart themes.
All visual elements are designed to emphasize state and regime, not discrete events.
Reliability
No repainting: all divergences and momentum states are confirmed on candle close and remain fixed.
Designed for consistency across instruments and timeframes.
Customization Options
Timeframe selection for MTF mode (leave empty to use the chart’s timeframe).
Adjustable signal smoothing parameters.
Divergence visibility controls, pivot sensitivity, and optional divergence fill.
Fully customizable color palette.
Usage Notes
This indicator is a visual market analysis tool intended to support momentum interpretation and structural context.
It does not provide investment advice, trading signals, or automated decision logic, and should be used as part of a broader analytical framework.
Final quotes:
"Trading is not about prediction, but about understanding momentum structure.
Digital MACD removes noise to make that structure visible."

RSI Apex: Breakout & DivergenceRSI Apex: Breakout & Divergence System
RSI Apex:突破与背离交易系统
🇬🇧 English Description
RSI Apex is a comprehensive trading system designed to capture both Trend Breakouts and Market Reversals. Unlike traditional RSI indicators that rely solely on fixed levels (70/30), RSI Apex integrates Donchian Channels, Volatility Squeeze, and the Libertus Divergence Algorithm to provide high-probability signals.
🚀 Key Features
Trend Push System (Donchian Breakout):
Detects when RSI momentum is strong enough to push the upper/lower Donchian Channel bands.
Signal: Displays ▲ (Bull) or ▼ (Bear) at levels 20/80.
Libertus Divergence (No-Lag):
Uses a real-time pivot tracking algorithm to identify divergences between Price and RSI without the lag of traditional pivot points.
Signal: Displays "Div" labels at levels 30/70.
Smart Coloring (Extreme Highlight):
Green/Red: Normal Trend.
White (Extreme): When RSI breaches 70 (Overbought) or 30 (Oversold), the line turns bright White. This highlights the most volatile zones where reversals or strong continuations occur.
Volatility Squeeze Filter:
Monitors market volatility. When the Donchian Channel compresses significantly (below historical average), the background turns Purple.
Meaning: "Calm before the storm"—expect a major move soon.
🛠 How to Use
Trend Following: Enter when you see Green/Red RSI lines accompanied by ▲ / ▼ signals. This indicates a "Trend Push."
Reversal Trading: Look for "Div" signals when the RSI line is White (Extreme). This suggests momentum is fading despite price action.
Exit/Take Profit: Watch for the "Weak" label, which appears when RSI falls back into the neutral zone.
Dashboard: Monitor real-time RSI Value, Market State (Bullish/Bearish/Extreme), and Volatility (Squeeze/Expanding) in the bottom-right table.
🇨🇳 中文简介
RSI Apex 是一套旨在捕捉趋势爆发 (Breakout) 和 市场反转 (Reversal) 的综合交易系统。与仅依赖固定 70/30 线的传统 RSI 不同,本指标融合了 唐奇安通道 (Donchian Channels)、波动率挤压 (Squeeze) 以及 Libertus 无滞后背离算法,以提供高胜率的交易信号。
🚀 核心功能
强趋势推动系统 (唐奇安突破):
检测 RSI 动能是否强劲到足以推动唐奇安通道的上轨或下轨扩张。
信号: 在 20/80 轴位置显示 ▲ (多头推动) 或 ▼ (空头推动)。
Libertus 智能背离 (无滞后):
采用实时 Pivot 追踪算法,精准识别价格与 RSI 之间的背离,解决了传统背离指标的滞后问题。
信号: 在 30/70 轴位置显示 "Div" 标签。
智能变色 (极端行情高亮):
绿色/红色: 正常趋势状态。
白色 (White): 极端区域。当 RSI 突破 70 (超买) 或跌破 30 (超卖) 时,线条会强制变为醒目的亮白色,提示此处为变盘/背离高发区。
波动率挤压 (Squeeze) 过滤器:
实时监控市场波动率。当通道宽度显著收窄(低于历史平均水平)时,背景会填充为半透明紫色。
含义: “暴风雨前的宁静”——预示着大行情即将爆发,此时应空仓等待突破方向。
🛠 使用策略
顺势交易 (Trend): 当 RSI 呈现 绿色/红色 并伴随 ▲ / ▼ 信号时进场。这代表动能极强,处于主升/主跌浪。
左侧反转 (Reversal): 重点关注 RSI 线条变为 白色 (Extreme) 时出现的 "Div" 背离信号。这通常意味着价格虽创新高,但动能已耗尽。
止盈/离场: 留意 "Weak" (衰竭) 标签,它出现在 RSI 掉回中间震荡区时。
仪表盘: 右下角面板实时显示 RSI 数值、市场状态 (极值/背离/趋势) 以及波动率状态 (挤压/扩张)。

ATR Trailing Stop + HTF + Pivots (Non-Repainting📌 UT Bot PRO + HTF + Pivots + PP SuperTrend (Non-Repainting)
This indicator is a fully non-repainting trading system designed for intraday and swing traders.
It combines multiple high-probability confirmations into a single, clean signal engine.
🔍 What’s Inside
✔ ATR-based trailing stop (UT-Bot style logic)
✔ Heikin Ashi price smoothing
✔ Heikin Ashi VWAP trend confirmation
✔ Higher-Timeframe EMA filter (no lookahead)
✔ Volume strength confirmation
✔ Auto timeframe Standard Pivot Points (PP, R1, R2, S1, S2)
✔ Pivot Point SuperTrend for market direction
✔ ATR-based Stop Loss & Take Profit levels
🔒 Non-Repainting Guarantee
Signals trigger only on confirmed candle close
Higher timeframe data uses lookahead_off
Pivot calculations are confirmed (no future data)
Signals will not disappear or shift after printing
📈 Trading Logic
BUY Signal
Price crosses above ATR trailing stop
Pivot SuperTrend is bullish
Price above HA VWAP
HTF EMA trend is bullish
Volume above average
SELL Signal
Price crosses below ATR trailing stop
Pivot SuperTrend is bearish
Price below HA VWAP
HTF EMA trend is bearish
Volume above average
⚙️ Recommended Settings
Intraday (5m–15m): HTF = 15m
Scalping (1m–5m): HTF = 5m
Swing (15m–1H): HTF = 1H
SL: 1.5 × ATR
TP: 3 × ATR
🧠 Best Used For
Crypto
Forex
Indices
Stocks
Works best in trending markets. Avoid very low-volume or choppy sessions.
⚠️ Disclaimer
This indicator is for educational purposes only.
No trading strategy guarantees profits. Always use proper risk management and test before live trading.

Trend Stress Quant [MarkitTick]💡This indicator combines a liquidity-based stress model with a dynamic linear regression channel to identify potential market exhaustion points and assess trend quality. By merging volume impact analysis with statistical deviation, this tool aims to highlight moments where price action may be overextended relative to the underlying liquidity conditions.
● Originality and Utility
Standard volatility indicators often rely solely on price range (like Bollinger Bands). This script introduces a Stress Engine that normalizes the relationship between Price Range (True Range) and Volume. This helps distinguish between healthy price movements and liquidity-stress events (illiquidity). Furthermore, instead of using a fixed-length channel, this tool offers a Dynamic Mode that anchors the regression channel to recent pivot points, ensuring the statistical analysis aligns with the current market structure rather than an arbitrary timeframe.
● Methodology
The script operates on two distinct mathematical models:
• Illiquidity Stress Engine
The core formula calculates a raw illiquidity metric based on the log-normal distribution of the ratio between True Range and Volume. A Z-Score (standard score) is then derived from this data over a specific lookback period. High Z-Scores indicate that price is moving disproportionately fast relative to the available volume, often a signature of panic selling or euphoric buying (exhaustion).
• Linear Regression Channel
The script calculates an Ordinary Least Squares (OLS) regression line (the line of best fit) to determine the mean price trend.
Standard Deviation Bands are plotted parallel to this mean.
Pearson Correlation Coefficient (R) is calculated to quantify the strength of the linear trend. Values closer to 1 or -1 indicate a strong trend, while values near 0 indicate a chaotic or ranging market.
📑 How to Use
Traders can utilize the visual outputs for mean reversion or trend continuation context:
• Exhaustion Signals (SE / BE Labels)
SE (Seller Exhaustion): Appears when the market is in a downtrend, but the Stress Engine detects a statistical anomaly (High Z-Score) on a down candle. This suggests panic selling may be peaking.
BE (Buyer Exhaustion): Appears when the market is in an uptrend, but the Stress Engine detects high stress on an up candle, suggesting a potential blow-off top.
• Regression Channel
The dashed middle line represents the fair value (mean) of the current trend.
The outer bands represent statistical extremes. Price interacting with the outer bands (default 2 Standard Deviations) while coincident with an Exhaustion Signal provides a high-confluence area of interest.
• Metrics Dashboard
A dashboard displays the current Trend Regime, Exhaustion Status, and Channel Width (volatility percentage).
● Settings
• Exhaustion Model
Trend Filter Length: Sets the baseline EMA to determine if the market is bullish or bearish.
Stress Threshold (Sigma): The Z-Score required to trigger an exhaustion signal (default is 2.0).
• Channel Configuration
Dynamic Pivot Mode: If enabled, automatically calculates the channel length based on recent pivots. If disabled, uses the Fixed Length.
Standard Deviations: Controls the width of the inner and outer channel bands.
📖This guide explains how to interpret and utilize signals for trading:
The script is designed primarily for Mean Reversion and Exhaustion trading strategies.
● The Core Strategy: Volatility Exhaustion
The script uses a "Stress Engine" to identify when price movement is statistically overextended relative to the available liquidity (Volume).
• Setup A: The "Seller Exhaustion" (Bullish Bounce)
Look for this setup during a downtrend to catch a temporary bottom or a reversal.
Trend Condition: The dashboard shows Bearish (Price is below the trend filter).
Trigger: The label SE (Seller Exhaustion) appears below a candle.
Why? This indicates that selling pressure was intense but likely panic-driven (High Z-Score/Stress) and may be drying up.
Confluence: Ideally, this signal appears when the price is touching or piercing the Lower Channel Band (dotted or solid lines).
Action: Traders often use this as a signal to close Short positions or enter a speculative Long (counter-trend) targeting the middle line.
• Setup B: The "Buyer Exhaustion" (Bearish Pullback)
Look for this setup during an uptrend to catch a local top.
Trend Condition: The dashboard shows Bullish .
Trigger: The label BE (Buyer Exhaustion) appears above a candle.
Why? This indicates euphoric buying on low liquidity or extreme volatility that is statistically unsustainable.
Confluence: Look for price rejection at the Upper Channel Band.
Action: Traders often use this to close Long positions or enter a Short targeting the mean.
● The Filter: Trend & Correlation
The script includes a Linear Regression Channel that quantifies the quality of the trend.
• Channel Slope
If the channel is angling steeply up or down, the trend is strong.
• Pearson R (Correlation)
The script calculates the Pearson R coefficient.
Weak Correlation: If the channel turns Gray/Neutral (or the fill becomes weak), it means the correlation is below the threshold (default 0.5).
Trading Rule: Avoid trading exhaustion signals when the channel is Gray/Neutral, as the market is likely chopping sideways with no clear direction.
● Risk Management & Targets
• Stop Loss
Since this is a volatility tool, a common technique is to place stops just outside the Outer Deviation Band (the widest line). If price expands beyond the outer band with no exhaustion signal, the trend may be entering a "runaway" phase.
• Take Profit
Target 1: The Middle Regression Line (The dashed center line). Prices tend to revert to this mean after an exhaustion event.
Target 2: The opposite channel band (e.g., if you bought at the bottom, hold until the top).
● Summary of Dashboard Metrics
The table on your chart provides a quick snapshot:
Trend Regime: Tells you if you should fundamentally look for Shorts (Bearish) or Longs (Bullish).
Seller/Buyer Status: Alerts you if the current bar is EXHAUSTED or Normal .
Channel Width %: Indicates volatility. If the width is very low (percentage is small), a breakout might be imminent (squeezing). If high, be careful of chop.
⚙️ Indicator settings
• Signal Parameters
Exhaustion & Stress Model: Controls signal sensitivity.
Trend Filter: Decides if the market is Bullish or Bearish.
Stress Threshold (Sigma): Higher values (e.g., 2.5) make the script stricter, showing fewer but potentially stronger signals.
• Channel Configuration
Dynamic Pivot Mode: If ON, the channel length auto-adjusts to recent market pivots. If OFF, it uses the Fixed Length you set.
Channel Bands: Adjusts the channel width.
Outer Deviation: The boundary for "extreme" moves. Price hitting this often signals a reversal.
• Quality Filter
Filter Weak Correlations: If enabled, the channel turns gray during choppy/sideways markets to warn you not to trust trend signals.
• Visuals
Display Options: Toggles the "Stats" dashboard and adjusts volatility coloring.
● Disclaimer
All provided scripts and indicators are strictly for educational exploration and must not be interpreted as financial advice or a recommendation to execute trades. I expressly disclaim all liability for any financial losses or damages that may result, directly or indirectly, from the reliance on or application of these tools. Market participation carries inherent risk where past performance never guarantees future returns, leaving all investment decisions and due diligence solely at your own discretion.

Daily Dual Pivots (Std + Fib) Extended by Jackel
簡介: 這個指標旨在為日內交易者提供最強大的支撐與阻力參考。它將市場上最常用的兩種 Pivot Points 計算方式——標準 (Standard) 與 斐波那契 (Fibonacci)——結合在同一個圖表中,讓你一眼就能看出關鍵的價格匯聚點 (Confluence Areas)。
主要特色:
雙重系統並存:
標準 Pivot (Standard):以 實線 (Solid Lines) 顯示。這是機構與大部分交易者使用的傳統支撐阻力位。
斐波那契 Pivot (Fibonacci):以 圓點/虛線 (Dotted Lines) 顯示。利用 Fib 黃金比例 (0.382, 0.618) 計算出的潛在反轉位。
清晰的視覺區分:標準版使用暖色系 (紅/綠/橙),Fib 版使用冷色系 (藍/紫),互不干擾,清晰易讀。
可選擴展關卡 (S4-S5 / R4-R5):預設顯示 P, R1-R3, S1-S3。如果市場波動劇烈,你可以在設定中開啟 "Show Extra Levels" 來顯示 R4/R5 及 S4/S5。
自動隱藏歷史:預設只顯示「當日」的線條,保持圖表整潔。如需回測,可開啟「顯示歷史數據」選項。
如何使用:
當 實線 (Standard) 與 虛線 (Fib) 重疊或非常接近時,該區域通常具有更強的支撐或阻力效力。
適用於 15分鐘、1小時或 4小時圖表操作日內交易。
Introduction: This indicator is designed for intraday traders who need precise Support & Resistance levels. It combines the two most popular Pivot Point calculation methods—Standard (Traditional) and Fibonacci—into a single chart, allowing you to easily identify key areas of confluence.
Key Features:
Dual System Strategy:
Standard Pivots: Displayed as Solid Lines. These represent the traditional structural levels used by most traders and institutions.
Fibonacci Pivots: Displayed as Dotted/Circle Lines. These use key Fibonacci ratios (0.382, 0.618) to identify potential reversal zones.
Visual Clarity: Different line styles and color groups allow you to distinguish between Standard and Fib levels instantly without chart clutter.
Extended Levels (Optional): By default, it shows P, R1-R3, and S1-S3. In highly volatile markets, you can enable "Show Extra Levels" in the settings to reveal S4/S5 and R4/R5.
Clean Chart: By default, it only shows levels for the current day. You can enable "Show History" in the settings if you need to backtest.
How to Use:
Look for Confluence: When a Solid Line (Standard) and a Dotted Line (Fib) overlap or are very close to each other, it indicates a very strong Support or Resistance zone.
Best used on 15m, 1H, or 4H charts for intraday analysis.

DarkPool's RSi DarkPool's RSi is an enhanced momentum oscillator designed to automatically detect structural discrepancies between price action and the Relative Strength Index. While retaining the standard RSI visualization, this script overlays advanced divergence recognition logic to identify potential trend reversals.
The tool identifies pivot points in real-time and compares recent peaks and valleys against historical data. When the momentum of the RSI contradicts the direction of price action, the indicator highlights these events using dynamic trendlines, shape markers, and background coloring. A built-in dashboard table provides an immediate status check of active divergence signals.
Key Features
Automated Divergence Detection: Automatically spots both Regular Bullish and Regular Bearish divergences based on pivot lookback settings.
Dynamic Visuals: Draws physical lines connecting RSI peaks or troughs to visualize the divergence angle, alongside triangle markers indicating the signal direction.
Active Status Dashboard: A data table located on the chart monitors the current state of the market, flagging signals as "Active" when detected.
Standard RSI Overlay: Includes standard Overbought (70) and Oversold (30) reference lines for traditional momentum trading.
How to Use
1. Reading the Standard RSI The black line represents the Relative Strength Index.
Overbought (Above 70): Suggests the asset may be overvalued and due for a pullback.
Oversold (Below 30): Suggests the asset may be undervalued and due for a bounce.
Midline (50): Acts as a trend filter; values above 50 indicate bullish momentum, while values below 50 indicate bearish momentum.
2. Trading Divergences The primary function of this tool is to identify reversal setups.
Bullish Divergence (Green Triangle/Line): Occurs when Price makes a Lower Low, but the RSI makes a Higher Low. This indicates that selling momentum is exhausting and a price increase may follow.
Bearish Divergence (Red Triangle/Line): Occurs when Price makes a Higher High, but the RSI makes a Lower High. This indicates that buying momentum is fading and a price decrease may follow.
3. Visual Aids
Lines: The script draws solid lines directly on the RSI pane connecting the relevant pivot points to confirm the divergence slope.
Background Color: When a divergence is detected, the background of the indicator pane will highlight briefly (Green for Bullish, Red for Bearish) to draw attention to the new signal.
4. The Dashboard A small table in the bottom right corner tracks the status of the signals.
Status: ACTIVE: A divergence has been detected within the last 10 bars.
Status: None: No recent divergence patterns have been identified.
Disclaimer This indicator is provided for educational and informational purposes only. It does not constitute financial advice, investment recommendations, or a guarantee of future results. Trading cryptocurrencies and financial markets involves a high level of risk. Always perform your own due diligence before making any trading decisions.

Pivot Reversal Signals - Multi ConfirmationPivot Reversal Signals - Multi-Confirmation System
Overview
A comprehensive reversal detection indicator designed for daytraders that combines six independent technical signals to identify high-probability pivot points. The indicator uses a scoring system to classify signal strength as Weak, Medium, or Strong based on the number of confirmations present.
How It Works
The indicator monitors six key reversal signals simultaneously:
1. RSI Divergence - Detects when price makes new highs/lows but RSI shows weakening momentum
2. MACD Divergence - Identifies divergence between price action and MACD histogram
3. Key Level Touch - Confirms price is at significant support/resistance (previous day high/low, premarket high/low, VWAP, 50 SMA)
4. Reversal Candlestick Patterns - Recognizes bullish/bearish engulfing, hammers, and shooting stars
5. Moving Average Confluence - Validates bounces/rejections at stacked moving averages (9/20/50)
6. Volume Spike - Confirms increased participation (default: 1.5x average volume)
Signal Strength Classification
• Weak (3/6 confirmations) - Small circles for situational awareness only
• Medium (4/6 confirmations) - Regular triangles, viable entry signals
• Strong (5-6/6 confirmations) - Large triangles with background highlight, highest probability setups
Visual Features
• Entry Signals: Green triangles (up) for long entries, red triangles (down) for short entries
• Exit Warnings: Orange X markers when opposing signals appear
• Signal Labels: Show confirmation score (e.g., "5/6") and strength level
• Key Levels Displayed:
o Previous Day High/Low - Solid green/red lines (uses actual daily data)
o Premarket High/Low - Blue/orange circles (4:00 AM - 9:30 AM EST)
o VWAP - Purple line
o Moving Averages - 9 EMA (blue), 20 EMA (orange), 50 SMA (red)
• Background Tinting: Subtle color on strongest reversal zones
Key Level Detection
The indicator uses request.security() to accurately fetch previous day's high/low from daily timeframe data, ensuring precise level placement. Premarket high/low levels are dynamically tracked during premarket sessions (4:00 AM - 9:30 AM EST) and plotted throughout the trading day, providing critical support/resistance zones that often influence price action during regular hours.
Customizable Parameters
• Signal strength thresholds (adjust required confirmations)
• RSI settings (length, overbought/oversold levels)
• MACD parameters (fast/slow/signal lengths)
• Moving average periods
• Volume spike multiplier
• Toggle individual display elements (levels, MAs, labels)
Best Practices
• Use on 5-minute charts for entries, confirm on 15-minute for direction
• Focus on Medium and Strong signals; Weak signals provide context only
• Strong signals (5-6 confirmations) have the highest win rate
• Pay special attention to reversals at premarket high/low - these levels frequently hold
• Previous day high/low often acts as major support/resistance
• Always use proper risk management and stop losses
• Works best in moderately trending markets
Alert Capabilities
Set custom alerts for:
• Strong long/short signals
• All entry signals (medium + strong)
• Exit warnings for open positions
Ideal For
• Daytraders and scalpers (especially SPY, QQQ, and liquid equities)
• Swing traders seeking precise entries
• Traders who prefer confirmation-based systems
• Anyone looking to reduce false signals with multi-factor validation
• Traders who utilize premarket levels in their strategy
Technical Notes
• Uses Pine Script v6
• Premarket hours: 4:00 AM - 9:30 AM EST
• Previous day levels pulled from daily timeframe for accuracy
• Maximum 500 labels to maintain chart performance
• All key levels update dynamically in real-time
________________________________________
Note: This indicator provides signal analysis only and should be used as part of a complete trading strategy. Past performance does not guarantee future results. Always practice proper risk management.

RSI Regime & Reversals (Leading) — Bull/Bear Trend Finder📈 RSI Regime & Reversals (Leading) — Bull/Bear Trend Finder
This advanced RSI-based tool helps identify bullish and bearish market trends before they happen — combining classic RSI analysis with Cardwell-style reversals and range shift detection to act as a leading indicator rather than a lagging one.
🧠 Core Concept
The script detects when RSI behavior “shifts ranges,” a signature of trend changes:
• Bull Regime — RSI pullbacks hold above ~40 (momentum stays strong)
• Bear Regime — RSI rallies stall below ~60 (momentum weakens)
It then looks for leading clues inside those regimes:
• ✅ Positive Reversal: Price makes a higher low while RSI makes a lower low — a bullish continuation or early trend reversal signal.
• ❌ Negative Reversal: Price makes a lower high while RSI makes a higher high — an early warning of weakness.
• 🔁 Classic Divergences: Confirms reversals when RSI and price diverge at pivot points.
🎯 Signals
• Green “▲ Bull lead” — bullish reversal or divergence detected.
• Red “▼ Bear lead” — bearish reversal or divergence detected.
• Optional background shading:
• 🟩 Teal = Bullish regime
• 🟥 Red = Bearish regime
⚙️ Customization
• Regime sensitivity — Adjust RSI floor/ceiling for your asset’s volatility.
• Pivot sensitivity — Tune pivot lookback (L/R bars) for faster or slower signals.
• RSI smoothing — Filters noise without losing responsiveness.
• Alerts included — Trigger TradingView alerts for bullish or bearish leading signals.
🕵️♂️ Why it’s different
Unlike standard RSI divergences (which confirm after the move), this indicator uses positive/negative reversals to identify potential trend shifts early — a technique favored by Andrew Cardwell’s RSI analysis.
📊 Works great for:
• Swing trading and trend detection
• Spotting momentum regime shifts
• Stocks, crypto, FX, indices

Quantum Market Analyzer X7Quantum Market Analyzer X7 - Complete Study Guide
Table of Contents
1. Overview
2. Indicator Components
3. Signal Interpretation
4. Live Market Analysis Guide
5. Best Practices
6. Limitations and Considerations
7. Risk Disclaimer
________________________________________
Overview
The Quantum Market Analyzer X7 is a comprehensive multi-timeframe technical analysis indicator that combines traditional and modern analytical methods. It aggregates signals from multiple technical indicators across seven key analysis categories to provide traders with a consolidated view of market sentiment and potential trading opportunities.
Key Features:
• Multi-Indicator Analysis: Combines 20+ technical indicators
• Real-Time Dashboard: Professional interface with customizable display
• Signal Aggregation: Weighted scoring system for overall market sentiment
• Advanced Analytics: Includes Order Block detection, Supertrend, and Volume analysis
• Visual Progress Indicators: Easy-to-read progress bars for signal strength
________________________________________
Indicator Components
1. Oscillators Section
Purpose: Identifies overbought/oversold conditions and momentum changes
Included Indicators:
• RSI (14): Relative Strength Index - momentum oscillator
• Stochastic (14): Compares closing price to price range
• CCI (20): Commodity Channel Index - cycle identification
• Williams %R (14): Momentum indicator similar to Stochastic
• MACD (12,26,9): Moving Average Convergence Divergence
• Momentum (10): Rate of price change
• ROC (9): Rate of Change
• Bollinger Bands (20,2): Volatility-based indicator
Signal Interpretation:
• Strong Buy (6+ points): Multiple oscillators indicate oversold conditions
• Buy (2-5 points): Moderate bullish momentum
• Neutral (-1 to 1 points): Balanced conditions
• Sell (-2 to -5 points): Moderate bearish momentum
• Strong Sell (-6+ points): Multiple oscillators indicate overbought conditions
2. Moving Averages Section
Purpose: Determines trend direction and strength
Included Indicators:
• SMA: 10, 20, 50, 100, 200 periods
• EMA: 10, 20, 50 periods
Signal Logic:
• Price >2% above MA = Strong Buy (+2)
• Price above MA = Buy (+1)
• Price below MA = Sell (-1)
• Price >2% below MA = Strong Sell (-2)
Signal Interpretation:
• Strong Buy (6+ points): Price well above multiple MAs, strong uptrend
• Buy (2-5 points): Price above most MAs, bullish trend
• Neutral (-1 to 1 points): Mixed MA signals, consolidation
• Sell (-2 to -5 points): Price below most MAs, bearish trend
• Strong Sell (-6+ points): Price well below multiple MAs, strong downtrend
3. Order Block Analysis
Purpose: Identifies institutional support/resistance levels and breakouts
How It Works:
• Detects historical levels where large orders were placed
• Monitors price behavior around these levels
• Identifies breakouts from established order blocks
Signal Types:
• BULLISH BRK (+2): Breakout above resistance order block
• BEARISH BRK (-2): Breakdown below support order block
• ABOVE SUP (+1): Price holding above support
• BELOW RES (-1): Price rejected at resistance
• NEUTRAL (0): No significant order block interaction
4. Supertrend Analysis
Purpose: Trend following indicator based on Average True Range
Parameters:
• ATR Period: 10 (default)
• ATR Multiplier: 6.0 (default)
Signal Types:
• BULLISH (+2): Price above Supertrend line
• BEARISH (-2): Price below Supertrend line
• NEUTRAL (0): Transition period
5. Trendline/Channel Analysis
Purpose: Identifies trend channels and breakout patterns
Components:
• Dynamic trendline calculation using pivot points
• Channel width based on historical volatility
• Breakout detection algorithm
Signal Types:
• UPPER BRK (+2): Breakout above upper channel
• LOWER BRK (-2): Breakdown below lower channel
• ABOVE MID (+1): Price above channel midline
• BELOW MID (-1): Price below channel midline
6. Volume Analysis
Purpose: Confirms price movements with volume data
Components:
• Volume spikes detection
• On Balance Volume (OBV)
• Volume Price Trend (VPT)
• Money Flow Index (MFI)
• Accumulation/Distribution Line
Signal Calculation: Multiple volume indicators are combined to determine institutional activity and confirm price movements.
________________________________________
Signal Interpretation
Overall Summary Signals
The indicator aggregates all component signals into an overall market sentiment:
Signal Score Range Interpretation Action
STRONG BUY 10+ Overwhelming bullish consensus Consider long positions
BUY 4-9 Moderate to strong bullish bias Look for long opportunities
NEUTRAL -3 to 3 Mixed signals, consolidation Wait for clearer direction
SELL -4 to -9 Moderate to strong bearish bias Look for short opportunities
STRONG SELL -10+ Overwhelming bearish consensus Consider short positions
Progress Bar Interpretation
• Filled bars indicate signal strength
• Green bars: Bullish signals
• Red bars: Bearish signals
• More filled bars = stronger conviction
________________________________________
Live Market Analysis Guide
Step 1: Initial Assessment
1. Check Overall Summary: Start with the main signal
2. Verify with Component Analysis: Ensure signals align
3. Look for Divergences: Identify conflicting signals
Step 2: Timeframe Analysis
1. Set Appropriate Timeframe: Use 1H for intraday, 4H/1D for swing trading
2. Multi-Timeframe Confirmation: Check higher timeframes for trend context
3. Entry Timing: Use lower timeframes for precise entry points
Step 3: Signal Confirmation Process.
For Buy Signals:
1. Oscillators: Look for oversold conditions (RSI <30, Stoch <20)
2. Moving Averages: Price should be above key MAs
3. Order Blocks: Confirm bounce from support levels
4. Volume: Check for accumulation patterns
5. Supertrend: Ensure bullish trend alignment.
For Sell Signals:
1. Oscillators: Look for overbought conditions (RSI >70, Stoch >80)
2. Moving Averages: Price should be below key MAs
3. Order Blocks: Confirm rejection at resistance levels
4. Volume: Check for distribution patterns
5. Supertrend: Ensure bearish trend alignment.
Step 4: Risk Management Integration
1. Signal Strength Assessment: Stronger signals = larger position size
2. Stop Loss Placement: Use Order Block levels for stops
3. Take Profit Targets: Based on channel analysis and resistance levels
4. Position Sizing: Adjust based on signal confidence
________________________________________
Best Practices
Entry Strategies
1. High Conviction Entries: Wait for STRONG BUY/SELL signals
2. Confluence Trading: Look for multiple components aligning
3. Breakout Trading: Use Order Block and Trendline breakouts
4. Trend Following: Align with Supertrend direction.
Risk Management
1. Never Risk More Than 2% Per Trade: Regardless of signal strength
2. Use Stop Losses: Place at invalidation levels
3. Scale Positions: Stronger signals warrant larger (but still controlled) positions
4. Diversification: Don't rely solely on one indicator.
Market Conditions
1. Trending Markets: Focus on Supertrend and MA signals
2. Range-Bound Markets: Emphasize Oscillator and Order Block signals
3. High Volatility: Reduce position sizes, widen stops
4. Low Volume: Be cautious of breakout signals.
Common Mistakes to Avoid
1. Signal Chasing: Don't enter after signals have already moved significantly
2. Ignoring Context: Consider overall market conditions
3. Overtrading: Wait for high-quality setups
4. Poor Risk Management: Always use appropriate position sizing
________________________________________
Limitations and Considerations
Technical Limitations
1. Lagging Nature: All technical indicators are based on historical data
2. False Signals: No indicator is 100% accurate
3. Market Regime Changes: Indicators may perform differently in various market conditions
4. Whipsaws: Possible in choppy, sideways markets.
Optimal Use Cases
1. Trending Markets: Performs best in clear trending environments
2. Medium to High Volatility: Requires sufficient price movement for signals
3. Liquid Markets: Works best with adequate volume and tight spreads
4. Multiple Timeframe Analysis: Most effective when used across different timeframes.
When to Use Caution
1. Major News Events: Fundamental analysis may override technical signals
2. Market Opens/Closes: Higher volatility can create false signals
3. Low Volume Periods: Signals may be less reliable
4. Holiday Trading: Reduced participation affects signal quality
________________________________________
Risk Disclaimer
IMPORTANT LEGAL DISCLAIMER FROM aiTrendview
WARNING: TRADING INVOLVES SUBSTANTIAL RISK OF LOSS
This Quantum Market Analyzer X7 indicator ("the Indicator") is provided for educational and informational purposes only. By using this indicator, you acknowledge and agree to the following terms:
No Investment Advice
• The Indicator does NOT constitute investment advice, financial advice, or trading recommendations
• All signals generated are based on historical price data and mathematical calculations
• Past performance does not guarantee future results
• No representation is made that any account will achieve profits or losses similar to those shown.
Risk Acknowledgment
• TRADING CARRIES SUBSTANTIAL RISK: You may lose some or all of your invested capital
• LEVERAGE AMPLIFIES RISK: Margin trading can result in losses exceeding your initial investment
• MARKET VOLATILITY: Financial markets are inherently unpredictable and volatile
• TECHNICAL ANALYSIS LIMITATIONS: No technical indicator is infallible or guarantees profitable trades.
User Responsibility
• YOU ARE SOLELY RESPONSIBLE for all trading decisions and their consequences
• CONDUCT YOUR OWN RESEARCH: Always perform independent analysis before making trading decisions
• CONSULT PROFESSIONALS: Seek advice from qualified financial advisors
• RISK MANAGEMENT: Implement appropriate risk management strategies
No Warranties
• The Indicator is provided "AS IS" without warranties of any kind
• aiTrendview makes no representations about the accuracy, reliability, or suitability of the Indicator
• Technical glitches, data feed issues, or calculation errors may occur
• The Indicator may not work as expected in all market conditions.
Limitation of Liability
• aiTrendview SHALL NOT BE LIABLE for any direct, indirect, incidental, or consequential damages
• This includes but is not limited to: trading losses, missed opportunities, data inaccuracies, or system failures
• MAXIMUM LIABILITY is limited to the amount paid for the indicator (if any)
Code Usage and Distribution
• This indicator is published on TradingView in accordance with TradingView's house rules
• UNAUTHORIZED MODIFICATION or redistribution of this code is prohibited
• Users may not claim ownership of this intellectual property
• Commercial use requires explicit written permission from aiTrendview.
Compliance and Regulations
• VERIFY LOCAL REGULATIONS: Ensure compliance with your jurisdiction's trading laws
• Some trading strategies may not be suitable for all investors
• Tax implications of trading are your responsibility
• Report trading activities as required by law
Specific Risk Factors
1. False Signals: The Indicator may generate incorrect buy/sell signals
2. Market Gaps: Overnight gaps can invalidate technical analysis
3. Fundamental Events: News and economic data can override technical signals
4. Liquidity Risk: Some markets may have insufficient liquidity
5. Technology Risk: Platform failures or connectivity issues may prevent order execution.
Professional Trading Warning
• THIS IS NOT PROFESSIONAL TRADING SOFTWARE: Not intended for institutional or professional trading
• NO REGULATORY APPROVAL: This indicator has not been approved by any financial regulatory authority
• EDUCATIONAL PURPOSE: Designed primarily for learning technical analysis concepts
FINAL WARNING
NEVER INVEST MONEY YOU CANNOT AFFORD TO LOSE
Trading financial instruments involves significant risk. The majority of retail traders lose money. Before using this indicator in live trading:
1. Practice on paper/demo accounts extensively
2. Start with small position sizes
3. Develop a comprehensive trading plan
4. Implement strict risk management rules
5. Continuously educate yourself about market dynamics
By using the Quantum Market Analyzer X7, you acknowledge that you have read, understood, and agree to this disclaimer. You assume full responsibility for all trading decisions and their outcomes.
Contact: For questions about this disclaimer or the indicator, contact aiTrendview through official TradingView channels only.
________________________________________
This study guide and indicator are published on TradingView in compliance with TradingView's community guidelines and house rules. All users must adhere to TradingView's terms of service when using this indicator.
Document Version: 1.0
Publisher: aiTrendview
________________________________________
Disclaimer
The content provided in this blog post is for educational and training purposes only. It is not intended to be, and should not be construed as, financial, investment, or trading advice. All charting and technical analysis examples are for illustrative purposes. Trading and investing in financial markets involve substantial risk of loss and are not suitable for every individual. Before making any financial decisions, you should consult with a qualified financial professional to assess your personal financial situation.

VSLRT with DivergencesOverview
This indicator combines Volume-Synchronized Linear Regression Trend (VSLRT) analysis with multi-indicator divergence detection to provide comprehensive market momentum and reversal signals. It displays volume-weighted price trends in both short-term and long-term timeframes, while simultaneously detecting divergences across 10 different technical indicators.
Key Features
VSLRT (Volume-Synchronized Linear Regression Trend):
Short-term and long-term trend analysis using linear regression
Volume-weighted calculations that account for buying vs selling pressure
Color-coded histogram showing trend strength and direction
Forecast projection showing anticipated trend continuation
Divergence-adjusted forecasting for enhanced prediction accuracy
Multi-Indicator Divergence Detection:
The indicator simultaneously monitors divergences across:
MACD (Moving Average Convergence Divergence)
MACD Histogram
RSI (Relative Strength Index)
Stochastic Oscillator
CCI (Commodity Channel Index)
Momentum
OBV (On-Balance Volume)
Volume-Weighted MACD
Chaikin Money Flow
Money Flow Index
Divergence Types:
Regular Bullish Divergence (potential reversal to upside)
Regular Bearish Divergence (potential reversal to downside)
Hidden Bullish Divergence (trend continuation upward)
Hidden Bearish Divergence (trend continuation downward)
How It Works
VSLRT Calculations:
The indicator calculates linear regression slopes for both price and volume, separating buying volume from selling volume. The histogram displays:
Green columns: Bullish price movement with strong buying volume
Red columns: Bearish price movement with strong selling volume
Shaded columns: Weaker conviction in the current trend
Thick line: Long-term trend direction
Divergence Detection:
The script automatically scans for divergences by comparing:
Price action (higher highs/lower lows)
Indicator values at pivot points
When price and indicators move in opposite directions, a divergence is detected
Divergences are displayed as labels on the histogram showing:
Which indicators are diverging
Number of simultaneous divergences (stronger signal when multiple indicators agree)
Color-coded by divergence type
Customizable Settings
VSLRT Settings:
Short-term length (default: 20)
Long-term length (default: 50)
Forecast bars (1-50, default: 10)
Divergence forecast adjustment factor
Custom colors for all trend states
Divergence Settings:
Pivot period for divergence detection
Source (Close or High/Low)
Divergence type (Regular, Hidden, or Both)
Minimum number of divergences to display
Maximum pivot points and bars to check
Toggle individual indicators on/off
Custom colors for each divergence type
Label display options (Full names, First letter, or Don't show)
Show divergence count option
Trading Applications
Trend Following:
Use VSLRT histogram to identify trend direction and strength
Enter trades when short-term and long-term trends align
Monitor forecast bars for potential trend continuation
Reversal Trading:
Watch for multiple regular divergences (3+ indicators)
Confirm with VSLRT color changes
Higher divergence count = stronger reversal signal
Trend Continuation:
Hidden divergences suggest trend will continue
Use during pullbacks in strong trends
Combine with VSLRT forecast for entry timing
Risk Management:
Divergence alerts can signal potential exits
VSLRT color changes can indicate stop-loss levels
Forecast helps anticipate trend exhaustion
Alert Conditions
Built-in alert conditions for:
Positive Regular Divergence Detected
Negative Regular Divergence Detected
Positive Hidden Divergence Detected
Negative Hidden Divergence Detected
Any Positive Divergence
Any Negative Divergence
Tips for Best Results
Multiple Timeframe Analysis: Check divergences on higher timeframes for more reliable signals
Confirmation: Wait for bar close (enabled by default) to avoid false signals
Volume Context: Stronger VSLRT signals occur during high volume periods
Divergence Count: More simultaneous divergences = higher probability signal
Trend Alignment: Best results when divergences align with overall trend direction
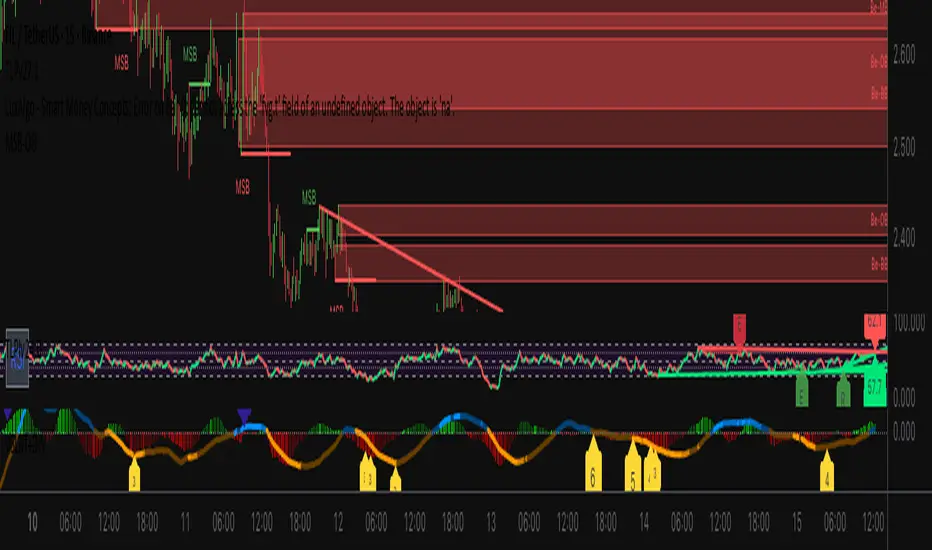
Strong PivotsThis finds pivots based on your inputs (number of candles back and forward that are above or below the range of the potential pivot points) and then optionally changes the color to help you visually identify the pivot. You can also specify pivots as strong pivots if they reverse in 1 time segment beyond a certain percentage (wick % of full candle range).
For example, if the pivot is at a high point but has a green body candle and a wick > 35% of the candle, it will change the body color to red to help visually understand that the candle can be considered a strong part of the downtrend, regardless of it closing green. This will help your mind interpret the top pivot candle as part of the potential trend reversal for the following candles and could even be used as part of your strategy ruleset.

Ultimate Sniper Entry - Pivot PerfectionT2R📌 Description
The Ultimate Sniper Entry – Pivot Perfection is a precision trading tool designed to identify high-probability pivot points and generate early buy/sell entries with strong confirmation. By combining pivot detection, volume spikes, momentum filters (RSI), candle patterns, and EMA trend alignment, this system helps traders capture market reversals and trend continuation setups with improved accuracy.
It offers:
Smart Pivot Detection with adjustable sensitivity.
Multi-layer Confirmation: volume, momentum, candle structure, and EMA trend filter.
Non-Repainting Signals: arrows plotted only after pivot confirmation.
Visual Aids: buy/sell arrows, optional pivot markers, background trend shading.
Alerts: instant notifications for sniper buy/sell entries.
Info Panel: quick reference guide directly on chart.
Ideal for traders who want structured, rules-based entries while avoiding false signals, the Ultimate Sniper Entry system adapts to multiple markets and timeframes.
